Use coupon code “WINTER20” for a 20% discount on all items! Valid until 30-11-2024

Site Logo
Search Suggestions

      Royal Mail  express delivery to UK destinations

      Regular sales and promotions

      Stock updates every 20 minutes!

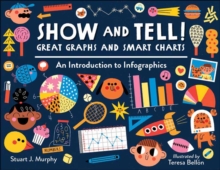
      Show and Tell! Great Graphs and Smart Charts: An Introduction to Infographics

      Out of stock

      Firm sale: non returnable item
      SKU 9781623541750 Categories ,
      Select Guide Rating
      A visual-learning expert races up the charts and graphs math success with kid-friendly content sure to help with homework.

      Want to find the most popular meal in the cafeteria? Compare town sports enrollments? Or maybe you just want to know who burps the most in y...

      £7.99

      Buy new:

      Delivery: UK delivery Only. Usually dispatched in 1-2 working days.

      Shipping costs: All shipping costs calculated in the cart or during the checkout process.

      Standard service (normally 2-3 working days): 48hr Tracked service.

      Premium service (next working day): 24hr Tracked service – signature service included.

      Royal mail: 24 & 48hr Tracked: Trackable items weighing up to 20kg are tracked to door and are inclusive of text and email with ‘Leave in Safe Place’ options, but are non-signature services. Examples of service expected: Standard 48hr service – if ordered before 3pm on Thursday then expected delivery would be on Saturday. If Premium 24hr service used, then expected delivery would be Friday.

      Signature Service: This service is only available for tracked items.

      Leave in Safe Place: This option is available at no additional charge for tracked services.

      Description

      Product ID:9781623541750
      Product Form:Paperback / softback
      Country of Manufacture:GB
      Title:Show and Tell! Great Graphs and Smart Charts
      Subtitle:An Introduction to Infographics
      Authors:Author: Stuart J. Murphy, Teresa Bellon
      Page Count:48
      Subjects:Children’s / Teenage: General interest, Children's / Teenage: general non-fiction
      Description:Select Guide Rating
      A visual-learning expert races up the charts and graphs math success with kid-friendly content sure to help with homework.

      Want to find the most popular meal in the cafeteria? Compare town sports enrollments? Or maybe you just want to know who burps the most in your family! Learn what line graphs, bar graphs, pie charts, and pictographs are and how and when to use them to represent data.

      Each project shows how to build a chart or graph and ties it all together with a creative infographic that really puts the A in STEAM (Science, Technology, Engineering, ARTS, and Mathematics). Whether used as an introductory aid or to underscore previous knowledge, the book prepares today''s visually savvy children to succeed in school and life by analyzing the world around them.
      Imprint Name:Charlesbridge Publishing,U.S.
      Publisher Name:Charlesbridge Publishing,U.S.
      Country of Publication:GB
      Publishing Date:2022-10-11

      Additional information

      Weight262 g
      Dimensions279 × 216 × 7 mm