Use coupon code “SUMMER20” for a 20% discount on all items! Valid until 2024-08-31

Site Logo
Search Suggestions

      Royal Mail  express delivery to UK destinations

      Regular sales and promotions

      Stock updates every 20 minutes!

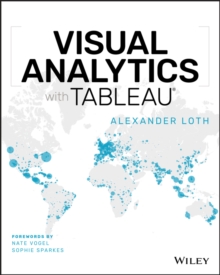
      Visual Analytics with Tableau

      2 in stock

      Firm sale: non returnable item
      SKU 9781119560203 Categories ,
      Select Guide Rating
      A four-color journey through a complete Tableau visualization Tableau is a popular data visualization tool that’s easy for individual desktop use as well as enterprise. Used by financial analysts, marketers, statisticians, business and sales leadership, and many other job r...

      £30.99

      Buy new:

      Delivery: UK delivery Only. Usually dispatched in 1-2 working days.

      Shipping costs: All shipping costs calculated in the cart or during the checkout process.

      Standard service (normally 2-3 working days): 48hr Tracked service.

      Premium service (next working day): 24hr Tracked service – signature service included.

      Royal mail: 24 & 48hr Tracked: Trackable items weighing up to 20kg are tracked to door and are inclusive of text and email with ‘Leave in Safe Place’ options, but are non-signature services. Examples of service expected: Standard 48hr service – if ordered before 3pm on Thursday then expected delivery would be on Saturday. If Premium 24hr service used, then expected delivery would be Friday.

      Signature Service: This service is only available for tracked items.

      Leave in Safe Place: This option is available at no additional charge for tracked services.

      Description

      Product ID:9781119560203
      Product Form:Paperback / softback
      Country of Manufacture:US
      Title:Visual Analytics with Tableau
      Authors:Author: Alexander Loth
      Page Count:288
      Subjects:Mathematics, Mathematics
      Description:Select Guide Rating
      A four-color journey through a complete Tableau visualization Tableau is a popular data visualization tool that’s easy for individual desktop use as well as enterprise. Used by financial analysts, marketers, statisticians, business and sales leadership, and many other job roles to present data visually for easy understanding, it’s no surprise that Tableau is an essential tool in our data-driven economy. Visual Analytics with Tableau is a complete journey in Tableau visualization for a non-technical business user. You can start from zero, connect your first data, and get right into creating and publishing awesome visualizations and insightful dashboards. •    Learn the different types of charts you can create •    Use aggregation, calculated fields, and parameters •    Create insightful maps •    Share interactive dashboards Geared toward beginners looking to get their feet wet with Tableau, this book makes it easy and approachable to get started right away.
      Imprint Name:John Wiley & Sons Inc
      Publisher Name:John Wiley & Sons Inc
      Country of Publication:GB
      Publishing Date:2019-05-31

      Additional information

      Weight586 g
      Dimensions187 × 232 × 13 mm