Customize Consent Preferences

We use cookies to help you navigate efficiently and perform certain functions. You will find detailed information about all cookies under each consent category below.

The cookies that are categorized as "Necessary" are stored on your browser as they are essential for enabling the basic functionalities of the site. ... 

Always Active

Necessary cookies are required to enable the basic features of this site, such as providing secure log-in or adjusting your consent preferences. These cookies do not store any personally identifiable data.

Functional cookies help perform certain functionalities like sharing the content of the website on social media platforms, collecting feedback, and other third-party features.

No cookies to display.

Analytical cookies are used to understand how visitors interact with the website. These cookies help provide information on metrics such as the number of visitors, bounce rate, traffic source, etc.

No cookies to display.

Performance cookies are used to understand and analyze the key performance indexes of the website which helps in delivering a better user experience for the visitors.

No cookies to display.

Advertisement cookies are used to provide visitors with customized advertisements based on the pages you visited previously and to analyze the effectiveness of the ad campaigns.

No cookies to display.

Use coupon code “MARCH20” for a 20% discount on all items! Valid until 31-03-2025

Site Logo
Site Logo

Royal Mail  express delivery to UK destinations

Regular sales and promotions

Stock updates every 20 minutes!

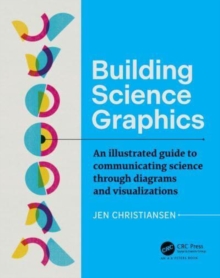
Building Science Graphics: An Illustrated Guide to Communicating Science through Diagrams and Visualizations

Out of stock

Firm sale: non returnable item
SKU 9781032109404 Categories ,
Building Science Graphics: An illustrated guide to communicating science through diagrams and visualizations is both a textbook and a practical guide for anyone—regardless of previous design experience and preferred drawing tools—interested in creating science-centric illustrated explanatory dia...

£94.99

Buy new:

Delivery: UK delivery Only. Usually dispatched in 1-2 working days.

Shipping costs: All shipping costs calculated in the cart or during the checkout process.

Standard service (normally 2-3 working days): 48hr Tracked service.

Premium service (next working day): 24hr Tracked service – signature service included.

Royal mail: 24 & 48hr Tracked: Trackable items weighing up to 20kg are tracked to door and are inclusive of text and email with ‘Leave in Safe Place’ options, but are non-signature services. Examples of service expected: Standard 48hr service – if ordered before 3pm on Thursday then expected delivery would be on Saturday. If Premium 24hr service used, then expected delivery would be Friday.

Signature Service: This service is only available for tracked items.

Leave in Safe Place: This option is available at no additional charge for tracked services.
Description

Product ID:9781032109404
Product Form:Hardback
Country of Manufacture:GB
Series:AK Peters Visualization Series
Title:Building Science Graphics
Subtitle:An Illustrated Guide to Communicating Science through Diagrams and Visualizations
Authors:Author: Jen Christiansen
Page Count:333
Subjects:The arts: general topics, The arts: general issues, Graphic design, Probability and statistics, Technical design, Environmental science, engineering and technology, Information technology: general topics, Digital animation, Computer science, Graphic design, Probability & statistics, Technical design, Environmental science, engineering & technology, Information technology: general issues, Digital animation, Computer science
Description:Building Science Graphics: An illustrated guide to communicating science through diagrams and visualizations is both a textbook and a practical guide for anyone—regardless of previous design experience and preferred drawing tools—interested in creating science-centric illustrated explanatory diagrams.

Building Science Graphics: An illustrated guide to communicating science through diagrams and visualizations is a practical guide for anyone—regardless of previous design experience and preferred drawing tools—interested in creating science-centric illustrated explanatory diagrams. Starting with a clear introduction to the concept of information graphics and their role in contemporary science communication, it then outlines a process for creating graphics using evidence-based design strategies. The heart of the book is composed of two step-by-step graphical worksheets, designed to help jump-start any new project. The author website, featuring further resources and links, can be found here: https://www.buildingsciencegraphics.com/. This is both a textbook and a practical reference for anyone that needs to convey scientific information in an illustrated form for articles, poster presentations, slide shows, press releases, blog posts, social media posts and beyond.


Imprint Name:Taylor & Francis Ltd
Publisher Name:Taylor & Francis Ltd
Country of Publication:GB
Publishing Date:2022-12-20