Use coupon code “SUMMER20” for a 20% discount on all items! Valid until 2024-08-31

Site Logo
Search Suggestions

      Royal Mail  express delivery to UK destinations

      Regular sales and promotions

      Stock updates every 20 minutes!

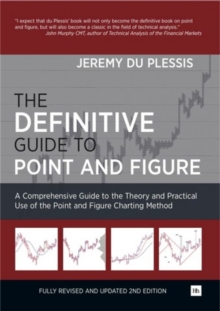
      The Definitive Guide to Point and Figure

      3 in stock

      Firm sale: non returnable item
      SKU 9780857192455 Categories ,
      Select Guide Rating
      Point and Figure charts are one of the great secrets of the Technical Analysis world. Highly sophisticated and with a thoroughbred pedigree, they can, however, be overlooked by traders today. This book provides an introduction of brand new techniques, demystifies the world of ...

      £69.95

      Buy new:

      Delivery: UK delivery Only. Usually dispatched in 1-2 working days.

      Shipping costs: All shipping costs calculated in the cart or during the checkout process.

      Standard service (normally 2-3 working days): 48hr Tracked service.

      Premium service (next working day): 24hr Tracked service – signature service included.

      Royal mail: 24 & 48hr Tracked: Trackable items weighing up to 20kg are tracked to door and are inclusive of text and email with ‘Leave in Safe Place’ options, but are non-signature services. Examples of service expected: Standard 48hr service – if ordered before 3pm on Thursday then expected delivery would be on Saturday. If Premium 24hr service used, then expected delivery would be Friday.

      Signature Service: This service is only available for tracked items.

      Leave in Safe Place: This option is available at no additional charge for tracked services.

      Description

      Product ID:9780857192455
      Product Form:Hardback
      Country of Manufacture:GB
      Title:The Definitive Guide to Point and Figure
      Authors:Author: Jeremy Du Plessis
      Page Count:540
      Subjects:Investment and securities, Stocks & shares
      Description:Select Guide Rating
      Point and Figure charts are one of the great secrets of the Technical Analysis world. Highly sophisticated and with a thoroughbred pedigree, they can, however, be overlooked by traders today. This book provides an introduction of brand new techniques, demystifies the world of Point and Figure charting.

      Point and Figure charts are one of the great secrets of the Technical Analysis world. Highly sophisticated and with a thoroughbred pedigree, they can, however, be overlooked by traders today. Jeremy du Plessis - one of the foremost Point and Figure experts in the world - returns with a fully updated second edition of this definitive guide in an effort to redress this imbalance.

      This second edition, with an extensive revision to the text and introduction of brand new techniques, demystifies the world of Point and Figure charting. It includes a detailed explanation of the history and development of the technique from its invention to the modern day, and covers the makeup of the chart patterns, why they are created, and how to interpret them.

      Throughout, readers are encouraged to understand Point and Figure charts from first principles, rather than just remember the names of a series of patterns. It is the first major work for 50 years to discuss in depth the original 1-box reversal method of Point and Figure charting and contrast it with the more popular 3-box reversal method. Further, the explanation of how to use Point and Figure charts to project targets and calculate risk-reward ratios is the most comprehensive ever seen.

      Also featured in the second edition are:

      - A step-by-step analysis of the FTSE 100 Index using the 3-box method, as well as the NASDAQ Composite Index, using the 1-box method

      - A detailed discussion of optimising techniques

      - An in-depth chapter on Analysing Point and Figure charts, extensively rewritten from the first edition

      - A new explanation of how Point and Figure parameters are chosen and the implications of choosing them

      - Two new Point and Figure construction methods never seen before

      - Point and Figure''s contribution to market breadth, with a look at bullish percent and two brand new indicators

      - Full discussion of Point and Figure gaps and how they provide valuable information about the chart

      - Lesser known, more advanced techniques such as the use of moving averages, parabolic SAR and Bollinger Bands on Point and Figure charts

      - Price and volume activity histograms and how they provide information about support and resistance

      All this is illustrated with numerous colour charts and observations from years of trading experience.
      According to du Plessis, Point and Figure charts are the ''voice of the market''. This book helps you listen to, and understand, that voice.

      Part of the Market Technicians Association (MTA) Required Reading list.

      Shortlisted for the 2013 Technical Analyst Book of the Year Award


      Imprint Name:Harriman House Publishing
      Publisher Name:Harriman House Publishing
      Country of Publication:GB
      Publishing Date:2012-09-28

      Additional information

      Weight1102 g
      Dimensions249 × 177 × 33 mm