Use coupon code “SUMMER20” for a 20% discount on all items! Valid until 2024-08-31

Site Logo
Search Suggestions

      Royal Mail  express delivery to UK destinations

      Regular sales and promotions

      Stock updates every 20 minutes!

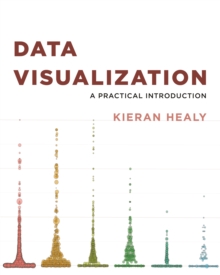
      Data Visualization: A Practical Introduction

      3 in stock

      Firm sale: non returnable item
      SKU 9780691181622 Categories ,
      Select Guide Rating
      An accessible primer on how to create effective graphics from dataThis book provides students and researchers a hands-on introduction to the principles and practice of data visualization. It explains what makes some graphs succeed while others fail, how to make high-quality fi...

      £38.00

      Buy new:

      Delivery: UK delivery Only. Usually dispatched in 1-2 working days.

      Shipping costs: All shipping costs calculated in the cart or during the checkout process.

      Standard service (normally 2-3 working days): 48hr Tracked service.

      Premium service (next working day): 24hr Tracked service – signature service included.

      Royal mail: 24 & 48hr Tracked: Trackable items weighing up to 20kg are tracked to door and are inclusive of text and email with ‘Leave in Safe Place’ options, but are non-signature services. Examples of service expected: Standard 48hr service – if ordered before 3pm on Thursday then expected delivery would be on Saturday. If Premium 24hr service used, then expected delivery would be Friday.

      Signature Service: This service is only available for tracked items.

      Leave in Safe Place: This option is available at no additional charge for tracked services.

      Description

      Product ID:9780691181622
      Product Form:Paperback / softback
      Country of Manufacture:US
      Title:Data Visualization
      Subtitle:A Practical Introduction
      Authors:Author: Kieran Healy
      Page Count:296
      Subjects:Social research and statistics, Social research & statistics, Mathematical and statistical software, Data capture and analysis, Data mining, Information visualization, Mathematical & statistical software, Data capture & analysis, Data mining, Information visualization
      Description:Select Guide Rating
      An accessible primer on how to create effective graphics from dataThis book provides students and researchers a hands-on introduction to the principles and practice of data visualization. It explains what makes some graphs succeed while others fail, how to make high-quality figures from data using powerful and reproducible methods, and how to t
      Imprint Name:Princeton University Press
      Publisher Name:Princeton University Press
      Country of Publication:GB
      Publishing Date:2018-12-18

      Additional information

      Weight700 g
      Dimensions253 × 202 × 17 mm