Customize Consent Preferences

We use cookies to help you navigate efficiently and perform certain functions. You will find detailed information about all cookies under each consent category below.

The cookies that are categorized as "Necessary" are stored on your browser as they are essential for enabling the basic functionalities of the site. ... 

Always Active

Necessary cookies are required to enable the basic features of this site, such as providing secure log-in or adjusting your consent preferences. These cookies do not store any personally identifiable data.

Functional cookies help perform certain functionalities like sharing the content of the website on social media platforms, collecting feedback, and other third-party features.

No cookies to display.

Analytical cookies are used to understand how visitors interact with the website. These cookies help provide information on metrics such as the number of visitors, bounce rate, traffic source, etc.

No cookies to display.

Performance cookies are used to understand and analyze the key performance indexes of the website which helps in delivering a better user experience for the visitors.

No cookies to display.

Advertisement cookies are used to provide visitors with customized advertisements based on the pages you visited previously and to analyze the effectiveness of the ad campaigns.

No cookies to display.

Use coupon code “MARCH20” for a 20% discount on all items! Valid until 31-03-2025

Site Logo
Site Logo

Royal Mail  express delivery to UK destinations

Regular sales and promotions

Stock updates every 20 minutes!

Microsoft Excel Data Analysis and Business Modeling (Office 2021 and Microsoft 365)

2 in stock

Firm sale: non returnable item
SKU 9780137613663 Categories ,
Select Guide Rating

Master business modeling and analysis techniques with Microsoft Excel and Office 365 and transform data into bottom-line results. Written by award-winning educator Wayne Winston, this hands-on, scenario-focused guide helps you use Excel to ask the right questions and get ac...

£37.99

Buy new:

Delivery: UK delivery Only. Usually dispatched in 1-2 working days.

Shipping costs: All shipping costs calculated in the cart or during the checkout process.

Standard service (normally 2-3 working days): 48hr Tracked service.

Premium service (next working day): 24hr Tracked service – signature service included.

Royal mail: 24 & 48hr Tracked: Trackable items weighing up to 20kg are tracked to door and are inclusive of text and email with ‘Leave in Safe Place’ options, but are non-signature services. Examples of service expected: Standard 48hr service – if ordered before 3pm on Thursday then expected delivery would be on Saturday. If Premium 24hr service used, then expected delivery would be Friday.

Signature Service: This service is only available for tracked items.

Leave in Safe Place: This option is available at no additional charge for tracked services.
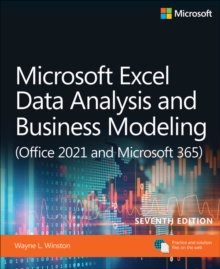
Description

Product ID:9780137613663
Product Form:Paperback / softback
Country of Manufacture:US
Series:Business Skills
Title:Microsoft Excel Data Analysis and Business Modeling (Office 2021 and Microsoft 365)
Authors:Author: Wayne Winston
Page Count:1168
Subjects:Spreadsheet software, Excel
Description:Select Guide Rating

Master business modeling and analysis techniques with Microsoft Excel and Office 365 and transform data into bottom-line results. Written by award-winning educator Wayne Winston, this hands-on, scenario-focused guide helps you use Excel to ask the right questions and get accurate, actionable answers. A lot has changed in Office 365 since the previous edition. This new edition covers new functions (STOCKHISTORY, LET, LAMBDA, XLOOKUP) and new array functions. It also covers the new Data types that have been added. Finally, we''ve increased the coverage of Power Pivot , Macros, and Power Query.

Practice with more than 800 problems, many based on actual challenges faced by working analysts. Solve real business problems with Excel—and build your competitive advantage:

  • Quickly transition from Excel basics to sophisticated analytics
  • Use PowerQuery or Get & Transform to connect, combine, and refine data sources
  • Leverage Office 365''s new Geography and Stock data types and six new functions
  • Illuminate insights from geographic and temporal data with 3D Maps
  • Summarize data with pivot tables, descriptive statistics, histograms, and Pareto charts
  • Use Excel trend curves, multiple regression, and exponential smoothing
  • Delve into key financial, statistical, and time functions
  • Master all of Excel''s great charts
  • Quickly create forecasts from historical time-based data
  • Use Solver to optimize product mix, logistics, work schedules, and investments—and even rate sports teams
  • Run Monte Carlo simulations on stock prices and bidding models
  • Learn about basic probability and Bayes'' Theorem
  • Use the Data Model and Power Pivot to effectively build and use relational data sources inside an Excel workbook
  • Automate repetitive analytics tasks by using macros

Master business modeling and analysis techniques with Microsoft Excel and transform data into bottom-line results. Award-winning educator Wayne Winston''s hands-on, scenario-focused guide helps you use today''s Excel to ask the right questions and get accurate, actionable answers. More extensively updated than any previous edition, new coverage ranges from one-click data analysis to STOCKHISTORY, dynamic arrays to Power Query, and includes six new chapters. Practice with over 900 problems, many based on real challenges faced by working analysts.


Solve real problems with Microsoft Excel—and build your competitive advantage

  • Quickly transition from Excel basics to sophisticated analytics
  • Use recent Power Query enhancements to connect, combine, and transform data sources more effectively
  • Use the LAMBDA and LAMBDA helper functions to create Custom Functions without VBA
  • Use New Data Types to import data including stock prices, weather, information on geographic areas, universities, movies, and music
  • Build more sophisticated and compelling charts
  • Use the new XLOOKUP function to revolutionize your lookup formulas
  • Master new Dynamic Array formulas that allow you to sort and filter data with formulas and find all UNIQUE entries
  • Illuminate insights from geographic and temporal data with 3D Maps
  • Improve decision-making with probability, Bayes'' theorem, and Monte Carlo simulation and scenarios
  • Use Excel trend curves, multiple regression, and exponential smoothing for predictive analytics
  • Use Data Model and Power Pivot to effectively build and use relational data sources inside an Excel workbook


Imprint Name:Addison Wesley
Publisher Name:Pearson Education (US)
Country of Publication:GB
Publishing Date:2022-02-26