Customize Consent Preferences

We use cookies to help you navigate efficiently and perform certain functions. You will find detailed information about all cookies under each consent category below.

The cookies that are categorized as "Necessary" are stored on your browser as they are essential for enabling the basic functionalities of the site. ... 

Always Active

Necessary cookies are required to enable the basic features of this site, such as providing secure log-in or adjusting your consent preferences. These cookies do not store any personally identifiable data.

Functional cookies help perform certain functionalities like sharing the content of the website on social media platforms, collecting feedback, and other third-party features.

No cookies to display.

Analytical cookies are used to understand how visitors interact with the website. These cookies help provide information on metrics such as the number of visitors, bounce rate, traffic source, etc.

No cookies to display.

Performance cookies are used to understand and analyze the key performance indexes of the website which helps in delivering a better user experience for the visitors.

No cookies to display.

Advertisement cookies are used to provide visitors with customized advertisements based on the pages you visited previously and to analyze the effectiveness of the ad campaigns.

No cookies to display.

Use coupon code “MARCH20” for a 20% discount on all items! Valid until 31-03-2025

Site Logo
Site Logo

Royal Mail  express delivery to UK destinations

Regular sales and promotions

Stock updates every 20 minutes!

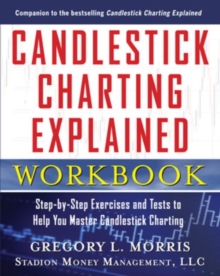
Candlestick Charting Explained Workbook: Step-by-Step Exercises and Tests to Help You Master Candlestick Charting

2 in stock

Firm sale: non returnable item
SKU 9780071742214 Categories ,
Select Guide Rating
A practical, hands-on guide to building your mastery of candlestick charting and analysisCandlestick charting has become one of today's most popular technical analysis tools for both individual and professional investors. And it's much easier than you probably think. In fact, ...

£25.99

Buy new:

Delivery: UK delivery Only. Usually dispatched in 1-2 working days.

Shipping costs: All shipping costs calculated in the cart or during the checkout process.

Standard service (normally 2-3 working days): 48hr Tracked service.

Premium service (next working day): 24hr Tracked service – signature service included.

Royal mail: 24 & 48hr Tracked: Trackable items weighing up to 20kg are tracked to door and are inclusive of text and email with ‘Leave in Safe Place’ options, but are non-signature services. Examples of service expected: Standard 48hr service – if ordered before 3pm on Thursday then expected delivery would be on Saturday. If Premium 24hr service used, then expected delivery would be Friday.

Signature Service: This service is only available for tracked items.

Leave in Safe Place: This option is available at no additional charge for tracked services.
Description

Product ID:9780071742214
Product Form:Paperback / softback
Country of Manufacture:US
Title:Candlestick Charting Explained Workbook: Step-by-Step Exercises and Tests to Help You Master Candlestick Charting
Authors:Author: Gregory Morris
Page Count:176
Subjects:Investment and securities, Investment & securities
Description:Select Guide Rating
A practical, hands-on guide to building your mastery of candlestick charting and analysisCandlestick charting has become one of today's most popular technical analysis tools for both individual and professional investors. And it's much easier than you probably think. In fact, creating a candlestick chart demands no more information than traditional charting requires. With candle pattern analysis, the payoff is a deeper look into the minds of investors and a clearer view of supply and demand dynamics. In this companion volume to his bestselling Candlestick Charting Explained, Gregory L. Morris delivers hands-on knowledge you need to make candlestick charting and analysis a key element of your portfolio-building strategy. With this book you will be able to:Identify candle patterns and quickly see what traders and investors are thinkingUse reversal patterns to enter or reverse your positionsIdentify continuation patterns to establish additional positionsUtilize charting software to recognize patterns automaticallyPacked with study questions, data tables, diagnostic tools, terminology, sample charts, and market analyses, Candlestick Charting Explained Workbook helps you speed up the learning process and ramp up the profits.

A practical, hands-on guide to building your mastery of candlestick charting and analysis

Candlestick charting has become one of today’s most popular technical analysis tools for both individual and professional investors. And it’s much easier than you probably think. In fact, creating a candlestick chart demands no more information than traditional charting requires. With candle pattern analysis, the payoff is a deeper look into the minds of investors and a clearer view of supply and demand dynamics.

In this companion volume to his bestselling Candlestick Charting Explained, Gregory L. Morris delivers hands-on knowledge you need to make candlestick charting and analysis a key element of your portfolio-building strategy. With this book you will be able to:

  • Identify candle patterns and quickly see what traders and investors are thinking
  • Use reversal patterns to enter or reverse your positions
  • Identify continuation patterns to establish additional positions
  • Utilize charting software to recognize patterns automatically

Packed with study questions, data tables, diagnostic tools, terminology, sample charts, and market analyses, Candlestick Charting Explained Workbook helps you speed up the learning process and ramp up the profits.


Imprint Name:McGraw-Hill Professional
Publisher Name:McGraw-Hill Education - Europe
Country of Publication:GB
Publishing Date:2012-01-16