Description
| Product ID: | 9781633696174 |
| Product Form: | Paperback / softback |
| Country of Manufacture: | US |
| Title: | Good Charts Workbook |
| Subtitle: | Tips, Tools, and Exercises for Making Better Data Visualizations |
| Authors: | Author: Scott Berinato |
| Page Count: | 288 |
| Subjects: | Business communication and presentation, Business communication & presentation |
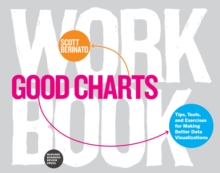
| Description: | Select Guide Rating Are you ready to create your own 'good charts' - data visualizations that more effectively communicate your ideas and research and that advance your career? The original Good Charts Talk. Sketch. Prototype. Repeat. You know right away when you see an effective chart or graphic. It hits you with an immediate sense of its meaning and impact. But what actually makes it clearer, sharper, and more effective? If you''re ready to create your own "good charts"--data visualizations that powerfully communicate your ideas and research and that advance your career—the Good Charts Workbook is the hands-on guide you''ve been looking for. The original Good Charts changed the landscape by helping readers understand how to think visually and by laying out a process for creating powerful data visualizations. Now, the Good Charts Workbook provides tools, exercises, and practical insights to help people in all kinds of enterprises gain the skills they need to get started. Harvard Business Review Senior Editor and dataviz expert Scott Berinato leads you, step-by-step, through the key challenges in creating good charts—controlling color, crafting for clarity, choosing chart types, practicing persuasion, capturing concepts—with warm-up exercises and mini-challenges for each. The Workbook includes helpful prompts and reminders throughout, as well as white space for users to practice the Good Charts talk-sketch-prototype process. Good Charts Workbook is the must-have manual for better understanding the dataviz around you and for creating better charts to make your case more effectively. |
| Imprint Name: | Harvard Business Review Press |
| Publisher Name: | Harvard Business Review Press |
| Country of Publication: | GB |
| Publishing Date: | 2019-01-22 |


