Description
| Product ID: | 9781032301006 |
| Product Form: | Paperback / softback |
| Country of Manufacture: | GB |
| Series: | AK Peters Visualization Series |
| Title: | Data Visualization for People of All Ages |
| Authors: | Author: Nancy Organ |
| Page Count: | 322 |
| Subjects: | Educational administration and organization, Organization & management of education, Primary and middle schools, Teacher training, Teachers’ classroom resources and material, Probability and statistics, Information technology: general topics, Programming and scripting languages: general, Software Engineering, Data capture and analysis, Educational material, Primary & middle schools, Teacher training, Teachers' classroom resources & material, Probability & statistics, Information technology: general issues, Programming & scripting languages: general, Software Engineering, Data capture & analysis, Educational material |
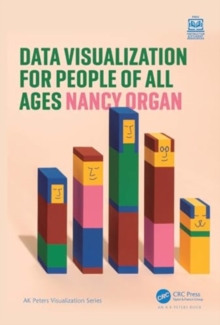
| Description: | Select Guide Rating The book is a field guide to visual literacy, born from the author’s personal experience working with world-class scholars, engineers, and scientists. By walking through the different ways of showing data—including color, angle, position, and length—you’ll learn how charts and graphs truly work so that no visualization is ever a mystery. Data visualization is the art and science of making information visible. On paper and in our imaginations, it’s a language of shapes and colors that holds our best ideas and most important questions. As we find ourselves swimming in data of all kinds, visualization can help us to understand, express, and explore the richness of the world around us. No matter your age or background, this book opens the door to new ways of thinking and sharing through the power of data visualization. Data Visualization for People of All Ages is a field guide to visual literacy, born from the author’s personal experience working with world-class scholars, engineers, and scientists. By walking through the different ways of showing data—including color, angle, position, and length—you’ll learn how charts and graphs truly work so that no visualization is ever a mystery or out of reach. It doesn’t stop at what fits on a page, either. You’ll journey into cutting-edge topics like data sonification and data physicalization, using sound and touch to share data across the different senses. Packed with practical examples and exercises to help you connect the dots, this book will teach you how to create and understand data visualizations on your own—all without writing a single line of code or getting tangled up in software. Written with accessibility in mind, this book invites everyone to the table to share the joy of one of today’s most necessary skills. Perfect for home or classroom use, this friendly companion gives people of all ages everything they need to start visualizing with confidence. |
| Imprint Name: | Taylor & Francis Ltd |
| Publisher Name: | Taylor & Francis Ltd |
| Country of Publication: | GB |
| Publishing Date: | 2024-04-24 |


