Use coupon code “WINTER20” for a 20% discount on all items! Valid until 30-11-2024

Site Logo
Search Suggestions

      Royal Mail  express delivery to UK destinations

      Regular sales and promotions

      Stock updates every 20 minutes!

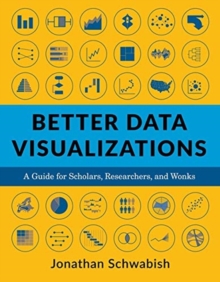
      Better Data Visualizations: A Guide for Scholars, Researchers, and Wonks

      3 in stock

      Firm sale: non returnable item
      SKU 9780231193115 Categories ,
      Select Guide Rating
      This book details essential strategies to create more effective data visualizations. Jonathan Schwabish walks readers through the steps of creating better graphs and how to move beyond simple line, bar, and pie charts.

      £30.00

      Buy new:

      Delivery: UK delivery Only. Usually dispatched in 1-2 working days.

      Shipping costs: All shipping costs calculated in the cart or during the checkout process.

      Standard service (normally 2-3 working days): 48hr Tracked service.

      Premium service (next working day): 24hr Tracked service – signature service included.

      Royal mail: 24 & 48hr Tracked: Trackable items weighing up to 20kg are tracked to door and are inclusive of text and email with ‘Leave in Safe Place’ options, but are non-signature services. Examples of service expected: Standard 48hr service – if ordered before 3pm on Thursday then expected delivery would be on Saturday. If Premium 24hr service used, then expected delivery would be Friday.

      Signature Service: This service is only available for tracked items.

      Leave in Safe Place: This option is available at no additional charge for tracked services.

      Description

      Product ID:9780231193115
      Product Form:Paperback / softback
      Country of Manufacture:US
      Title:Better Data Visualizations
      Subtitle:A Guide for Scholars, Researchers, and Wonks
      Authors:Author: Jonathan Schwabish
      Page Count:464
      Subjects:Encyclopaedias and reference works, Encyclopaedias & reference works
      Description:Select Guide Rating
      This book details essential strategies to create more effective data visualizations. Jonathan Schwabish walks readers through the steps of creating better graphs and how to move beyond simple line, bar, and pie charts.
      Imprint Name:Columbia University Press
      Publisher Name:Columbia University Press
      Country of Publication:GB
      Publishing Date:2021-02-09

      Additional information

      Weight1162 g
      Dimensions178 × 229 × 31 mm