Use coupon code “SUMMER20” for a 20% discount on all items! Valid until 2024-08-31

Site Logo
Search Suggestions

      Royal Mail  express delivery to UK destinations

      Regular sales and promotions

      Stock updates every 20 minutes!

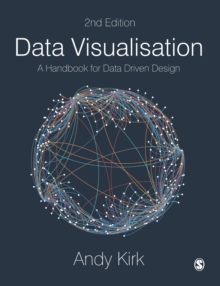
      Data Visualisation: A Handbook for Data Driven Design

      20 in stock

      Firm sale: non returnable item
      SKU 9781526468925 Categories ,
      Select Guide Rating
      With over 200 images and extensive how-to and how-not-to examples, the new edition of the book The Financial Times voted one of the ‘six best books for data geeks’ has everything students and scholars need to understand and create effective data visualisations.

      <stro...

      £47.99

      Buy new:

      Delivery: UK delivery Only. Usually dispatched in 1-2 working days.

      Shipping costs: All shipping costs calculated in the cart or during the checkout process.

      Standard service (normally 2-3 working days): 48hr Tracked service.

      Premium service (next working day): 24hr Tracked service – signature service included.

      Royal mail: 24 & 48hr Tracked: Trackable items weighing up to 20kg are tracked to door and are inclusive of text and email with ‘Leave in Safe Place’ options, but are non-signature services. Examples of service expected: Standard 48hr service – if ordered before 3pm on Thursday then expected delivery would be on Saturday. If Premium 24hr service used, then expected delivery would be Friday.

      Signature Service: This service is only available for tracked items.

      Leave in Safe Place: This option is available at no additional charge for tracked services.

      Description

      Product ID:9781526468925
      Product Form:Paperback / softback
      Country of Manufacture:GB
      Title:Data Visualisation
      Subtitle:A Handbook for Data Driven Design
      Authors:Author: Andy Kirk
      Page Count:328
      Subjects:Research methods: general, Research methods: general, Database design and theory, Database design & theory
      Description:Select Guide Rating
      With over 200 images and extensive how-to and how-not-to examples, the new edition of the book The Financial Times voted one of the ‘six best books for data geeks’ has everything students and scholars need to understand and create effective data visualisations.

      One of the "six best books for data geeks" - Financial Times

      With over 200 images and extensive how-to and how-not-to examples, this new edition has everything students and scholars need to understand and create effective data visualisations.

      Combining ‘how to think’ instruction with a ‘how to produce’ mentality, this book takes readers step-by-step through analysing, designing, and curating information into useful, impactful tools of communication.

      With this book and its extensive collection of online support, readers can:

      • Decide what visualisations work best for their data and their audience using the chart gallery
      • See data visualisation in action and learn the tools to try it themselves
      • Follow online checklists, tutorials, and exercises to build skills and confidence
      • Get advice from the UK’s leading data visualisation trainer on everything from getting started to honing the craft.

      Imprint Name:Sage Publications Ltd
      Publisher Name:Sage Publications Ltd
      Country of Publication:GB
      Publishing Date:2019-08-21

      Additional information

      Weight726 g
      Dimensions189 × 244 × 20 mm